|
|
|
 |
|
|
| Game Theory and Market Simulation |
|
Equilibrium Tendencies From Market Structure
Success in deregulating markets depends on understanding the dynamics of price trajectories. Devonrue employs dynamic simulation to model price trajectories by competitive scenario, and game theory to isolate a finite set of strategy combinations (scenarios) and optimal business strategies.
This topical uses the Cournot competitive game to introduce those core dynamics, provide some mathematical background, and highlight Cournot models and game theory as a way to forecast price trajectories and optimize business strategies.
We begin with two concepts important to both Cournot models and game theory:
(1) An indicated market equilibrium price can be calculated for multicompetitor markets, including markets with horizontal and vertical dispersion, and
(2) Actual market prices tend to converge towards that equilibrium.
Both ideas are essential to accurate forecasting of market scenarios -- especially in today's increasingly fragmented and complex markets. These mathematical ideas provide a basic explanation why Devonrue's market simulations work -- with deadly accuracy -- in forecasting prices and identifying optimal business performance in multicompetitor markets.
Modern game theory inherited Cournot's tradition, and provides a useful mechanism for explaining market dynamics. Hence, we begin with a Cournot treatment of markets, and calculate equilibrium results for a 2-competitor market. Next, we extend the results to multicompetitor markets. Finally, we introduce practical applications of game theoretic approaches to important business problems, as reported in contemporary marketing literature.
Cournot Equilibrium and Market Stabilizing Forces
Antoine Cournot was a 19th century mathematician who introduced an important class of models describing competitive behavior -- a class of models that captures both production and price as strategy levers (Cournot, 1838, 1927). In his time, mathematics was undergoing a wide range of important developments that ultimately became the foundation of convergence theories of modern analysis. While highly distilled, Cournot's models had a significant on market models, and are evident in economic, game-theoretic, and market structure models to this day.
Cournot's production and pricing levers explain pricing dynamics and their role in stabilizing market fundamentals. Two ideas are particularly important to these dynamics: the notion of "na・e assumptions," and zero marginal cost.
Cournot's na・e assumptions are important because they endogenously generate market correction forces that drive the market towards equilibrium. A second and equally important result immediately follows -- that market structure dictates market behavior more than particular conditions. As John Nash later showed, the critical role of market structure makes possible two crystallizing results -- that there are only a finite set of pure strategy combinations, and that a optimal strategy combination exist among those combinations.
In other words, Cournot's assumptions are illuminating, essential, and very practical.
In a Cournot model, the essential "na・e assumption" is that each competitor's strategy ignores potential competitor reactions that might blunt their effect. For example, when considering an investment in new capacity, Cournot's model assumes that the investment analysis can (and probably will) naively ignore or underestimate without consequence the potential upshot or competitive riposte -- that the new capacity might induce a competitor to drop prices in an attempt to hold onto market share and defend the market position.
Na・e assumptions are not as artificial as they might seem at first blush. Business decision processes often mimic Cournot's naive assumptions quite closely, either consciously or as a practical matter. For example, many business plans for new markets and technologies ignore or discount competitor response, or limit the number of scenarios considered to a very small set. Regardless of the reasons for limited analysis -- face time before the Executive Committee, the "Dilbert Theory of Management," or the artificialities of typical pro formas run on a spreadsheet -- competitor dynamics often receive limited quantitative treatment. Hence, Cournot's assumptions are close to the mark.
The second naive assumption in Cournot models is equally simplifying and important: marginal cost is zero. That is, as demand increases, no additional costs are incurred in serving that demand. This assumption is not unrealistic at the limit for many highly scaled capital-intensive enterprises with readily expandable capacity. In any case, subsequent extensions have relaxed this assumption without loss of generality. For purposes of this introduction and historical context, however, we retain Cournot's original assumption.
Cournot uses these assumptions to illustrate the market's dynamic response as a convergence to equilibrium. Note that convergence is a tendency or a limit process -- there is no requirement that equilibrium is actually achieved.
These ideas are important because they provide a mechanism for modeling price trajectories.
Cournot Model As a Two-Competitor Game
Let's use game theory to illustrate Cournot's dynamics (for game theory's "Old Testament," see see Von Neumann and Morgenstern, 1953).
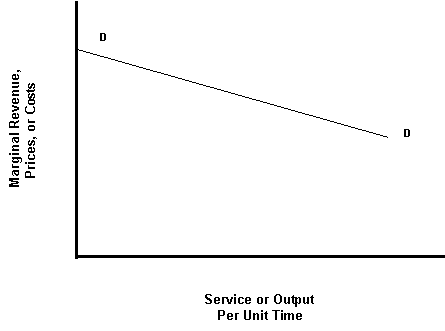
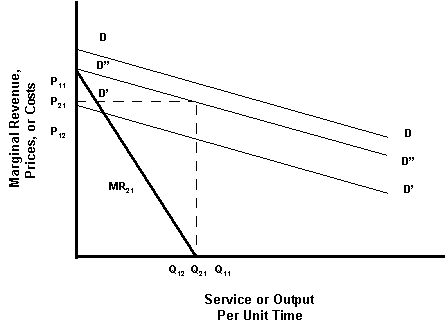
Assume a demand curve, illustrated as DD in the accompanying graph. This curve characterizes a competitor's perception or expectation of consumer response to price. A downward-sloping curve, as shown, suggests that customers cut back on their purchases as prices increase. The slope or angle of the curve indicates how quickly customers respond to price changes -- flat curves characterize highly competitive markets, while steeper curves are less price sensitive.
Demand curves are the simplest, and yet the most important market model one can devise. Their power arises from the fact they are not necessarily unique, stationary over time, or even stable.
For one thing, there is not necessarily one demand curve for any market. Customer preferences change with time and these changes mean that demand curves can slide left or right, up or down, or even rotate. Further, while it may be convenient for demand curves to be linear, as shown, they don't have to be.† In a turbulent market where customers are often confused, demand curves can create "bubbles" or "updrafts" in which as prices rise, and demand accelerates in response to perceived shortages and the potential for rationing.
Competitors may not even agree on market definition, and demand curves are quite useful in capturing alternative perceptions. More likely than not, different competitors carry around different perceptions of customer response, reflecting different segmentations as well as data. In other words, there may well be, and probably are, multiple demand curves motivating competitors. The interplay of competitor-specific demand curves actually drives market dynamics as will be shown.
Since we intend to keep this discussion simple, we'll assume one market segmentation and one demand curve precisely describes customer preferences. Let's see how competitor-specific demand curves drive market dynamics.
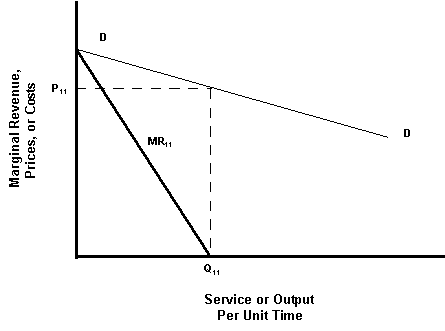
Assume a firm (Competitor 1) enters a market characterized by demand curve DD, and sets her price to maximize her margin. By simple calculus, optimal margins are achieved when the marginal revenue equals the marginal cost. But, since the marginal cost is zero, her marginal revenue curve (MR11) intersects the horizontal axis at "take rate" Q11. To achieve this "take rate" (production rate), therefore, the competitor must set her price at P11, which she does as illustrated in the accompanying graph.
And, with that, Competitor 1 quickly takes over the market, hands out outrageous bonuses to her sales force (and the Executive Committee, of course), the stock climbs into the stratosphere, the overworked staff cashes in on some warrants, and the young, "visionary" CEO makes the cover of Forbes Magazine.
Life is good for Competitor 1. For a while, at least. Or, at least until Forbes Magazine appears on the newsstand reporting Competitor 1's "spectacular performance in the exciting and revolutionary new market of ... "
So revolutionary and exciting is this new market that Competitor 2 decides she would like a piece of it, too. Her business analysts download lots of "data" from the usual sources and articles from the industry rags. They immediately conclude there's a lot of demand left on the table -- and more to come as the market grows. Moreover, their spreadsheet arithmetic promises BIG BUCKS from the untapped demand -- the "potential" market demand, minus Competitor 1's current "take rate." The way Competitor 2 sees it, if she cuts her prices and runs a tighter ship, she can still beat the hurdle rate set by the Executive Committee. Plus, there may be some extra margin out there if the lower prices also "churn" those Competitor 1's customers considered less than fully loyal.
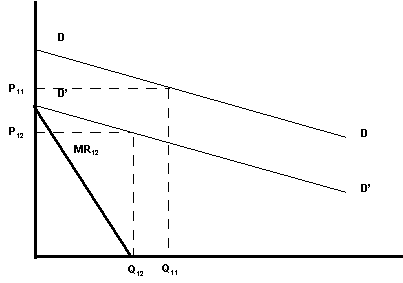
Competitor 2 implicitly acts as if her very own demand curve is D'D'. Consequently, she also sets her price in the usual way so to maximize marginal revenue -- i.e., when marginal revenue equals her marginal cost. As second player in the game, Competitor 2 anticipates (consciously or unconsciously) a different market response (D'D'). Her marginal revenue (MR12) is necessarily different. Accordingly, Competitor 2 sets prices below her competitor, say at P12, and expects to capture a "take rate" of "only" Q12.
Few companies actually use demand curves or analysis of this kind. Most of the "number crunching" involves cost-based spreadsheet analysis of revenues, costs, and cash margins. The cost numbers are often rigorously studied. In contrast, the revenue numbers start with volume, assume the growth rates proclaimed by industry gurus, and further assume price profiles. The cash margins are whatever's left over.
But, as a practical matter, revenue WAGs reflect a built-in assumption of demand which can best be represented by a demand curve. It may not be much of a rational curve, but there's one out there behind all the WAG.
Returning to our story, "surprise surprise," Competitor 2'stake rate outperforms her spreadsheet projections. It turns out there was successful churning of Competitor 1's share. In addition, the market was destabilized by the excess supply at lower prices, which only accelerate the customer churn rate. Both factors create important market dynamics that tend towards convergence and stabilization.
Let's go back to Competitor 1 and what she perceives as Competitor 2 rolls out her new offering priced below Competitor 1. As the BusinessWeek cover story about Competitor 2's entry reports, Competitor 1's market eroded with Competitor 2's multimillion advertising campaign. Competitor 1's margins dropped off (followed almost immediately by collapsing stock prices). Previously loyal Competitor 1 customers were not reordering as before. Competitor 1's business analysts were talking about a price reduction to re-optimize performance. Competitor 1's "visionary" CEO suddenly stepped down in favor of a "Gray Beard" brought on-board from the soft drink industry. Trench warfare is setting in.
The accompanying figure illustrates the next round's dynamic. For Competitor 1, DD is no longer her demand curve. When Competitor 2 sliced into Competitor 1's customer base, she also reset the Competitor 1 demand curve. Consequently, Competitor 1 now sees D"D" as her new demand curve, generated by subtracting Competitor 2's take rate from the original DD rate. Competitor 1's new or "second round" marginal revenue curve, MR21, intersects the marginal cost curve at Q21 for Price21. As the former soft drink CEO promises, Competitor 1's just-announced layoffs and price cuts will stabilize market share and return the company to profitability.
Which, of course, presents a problem for Competitor 2 in its next round of the 2-competitor game. And so on, and so on as the game continues and prices converge.
This iterative process continues until one of two things happen: (1) a static or dynamic equilibrium is achieved, or (2) the game is modified (e.g., new market segments identified, product features enhanced, or another player enters as a competitor or ally). If equilibrium becomes "end game," it results from na・e, goal-seeking behavior employed by both players attempting to maximize margins. The na・e business strategy creates an alternating power series that converges.
Why Seemingly Good Business Plans Go Bad
Cournot's model teaches an important lesson often overlooked in today's business plans: the extreme danger of assuming production quantities ("take rates") and prices, as many business plans often do.
Analysts tend to assume rates and prices because they don't know how to calculate them on a spreadsheet.
However, production rates and prices are inherently dynamic over time. They introduce important feedback loops that influence the market, competitors, and investment decisions -- not to mention prices and production itself.
There is a second danger to making assumptions and acting on them -- things in nature that are dynamic tend to react in surprising ways (even violently) whenever they are artificially restrained or constrained. The further one's business strategy departs from reality, the more surprising the results can be.
But, dynamic quantities are predictable, despite inherent tendencies to converge to limiting or equilibrium values. Devonrue's market simulations do just that in time-steps of 1-week extending out over 5-15 years.
But you don't need a computer simulation to model prices under steady-state conditions. Equilibrium prices can be estimated using game theory or even a Cournot Model.
In the simple, 2-competitor game discussed previously, ignoring product innovation and market segmentation effects, the Cournot equilibrium occurs when both competitors price at PE and result in equal-valued "take rates" of 1/2QE, totaling QE. If those rates are profitable, stability continues until more competitors enter the market. If they are not profitable, one or both competitors subsidize the market until someone runs out of money and exits.
In summary, seemingly good business plans go bad when they ignore equilibrium price conditions, or make price assumptions that turn out false. This generally occurs when the spreadsheet models focus on costs, assume prices to support costs, and overlook the competitive dynamics.
Game Theory's Extensions to Multiple Competitors
Market mathematics have been extended a great distance in the 150 years since Cournot outlined the simple duopoly that emerges from competitive dynamics. The most important contemporary result of game theory is reflected in the 1994 Nobel Prize in Economic Science awarded to Princeton mathematician John Nash, John Harsanyi, and Reinhard Selten. Developing Cournot's idea, Nash proved a generalized theorem describing equilibrium conditions for players in direct competition. This condition is known as a Nash Equilibrium, his theorem follows:
Each player in any n-person game has a finite number of pure strategies for which there is at least one equilibrium set of strategies for the game.
A Nash-equilibrium generalization of Cournot's 2-competitor game can be readily generated for any multi-competitor game (Kreps et al., 1983). This means only a finite number of scenarios need be modeled to identify the optimal market strategy. And, once modeled, these optimal conditions can be translated into financial and production performance.
Assume an isoelastic demand curve whereby market revenue is solely a function of customer's income, and price is limited by monopoly price. Further assume "Firms" represents the number of competitors that enter the market at its creation. Then, at some arbitrary stage, eachfirm's profits are given by price and output. At the limit, the Cournot equilibrium service or output yields the symmetric Cournot equilibrium price:

The corresponding relationship can be visualized as a surface for unit cost and discrete number of firms.
One important result illustrated by this surface is the well-known margin compression that occurs as unit costs decline (e.g., as a function of Moore's Law), and the number of competitors rises. The actual path traced on an inferred surface varies with the parameters, but is monotonically declining at decreasing rates.
For the cases calculated, the Cournot equilibria range is robust. For example, across the domain of 0-33% cost reductions/advantages, and monopolist-10 equal competitors, the range of indicated margins extends from less than 10% to almost 300%(!).
Market Evidence and Practical Computational Solutions to Generalized Conditions
The Cournot competitive game is a valuable indicator of market dynamic trends, and can be useful to guiding business strategy. Further, Nash's result demonstrates one need not consider an unduly large list of scenarios to isolate the optimal business strategy.
The game-theoretic approach has been shown to be effective in explaining seemingly contradictory market behavior while effectively forecasting price trajectories. For example, price wars during market booms is a common phenomenon in technology markets fed by convergence technologies (Roternberg and Scheinkman, 1983).
Another area particularly amenable to computer simulation is using excess demand as a marketing strategy (DeGraba, 1994. This practice is common in a variety of media, retail software, and technology segments. The practice involves generating positive-feedback dynamics as part of roll-out --in other words, temporarily altering the demand curve. Anecdotal examples include the pre-emptive press release to signal competitors that a significant investment is about to be made.
Finally, Devonrue's market simulations have been particularly effective modeling nonlinear pricing as a segment discriminator (Stole, 1995). Nonlinear pricing has a long history as a signal to customers concerning perceive quality and other product attributes. Most notable is Sloan's Chevrolet roll-out to displace Ford's Model-T. More recently, optimal pricing schedules can be identified by segment value, considering horizontal preference uncertainties (e.g., "brand preferences") as well as vertical uncertainties (e.g., telecom quality and bandwidth).
For additional technical and mathematical information concerning the computer simulation of prices, and optimal business strategy, drop us a line at info@economist.co.jp
参考文献
Cournot, A., Recherches sur les principes mathmatiques de la thorie des richesses, Paris, 1838, and translated by Bacon, N. T., as Researches into the Mathematical Principles of the Theory of Wealth, London: N. V. Macmillan & Co., 1927
DeGraba, P., "Buying Frenzies and Seller-induced Excess Demand," RAND Journal of Economics, V. 26, pp. 331-342
Kreps, D. M. and Scheinkman, J. A., "Quantity Precommitment and Bertrand Competition Yield Cournot Outcomes," Bell Journal of Economics, V. 14 (1983), pp. 326-337
Rotemberg, J. J. and Saloner, G., "A Supergame-Theoretic Model of Price Wars During Booms," American Economic Review, V. 76 (1986), pp. 390-407
Stole, L. A., "Nonlinear Pricing and Oligopoly," Journal of Economics & Management Strategy, V. 4, (1995), pp. 529-562
Von Neumann, J. and Morgenstern, O., Theory of Games and Economic Behavior, Third Edition, Princeton: Princeton University Press, 1953
    |
|
|
|