|
|
|
 |
|
|
データ可視化,データマイニングおよび統計のための高速な直感的ツール
DataDesk
|
|
ドラッグ&ドロップ・インタフェース

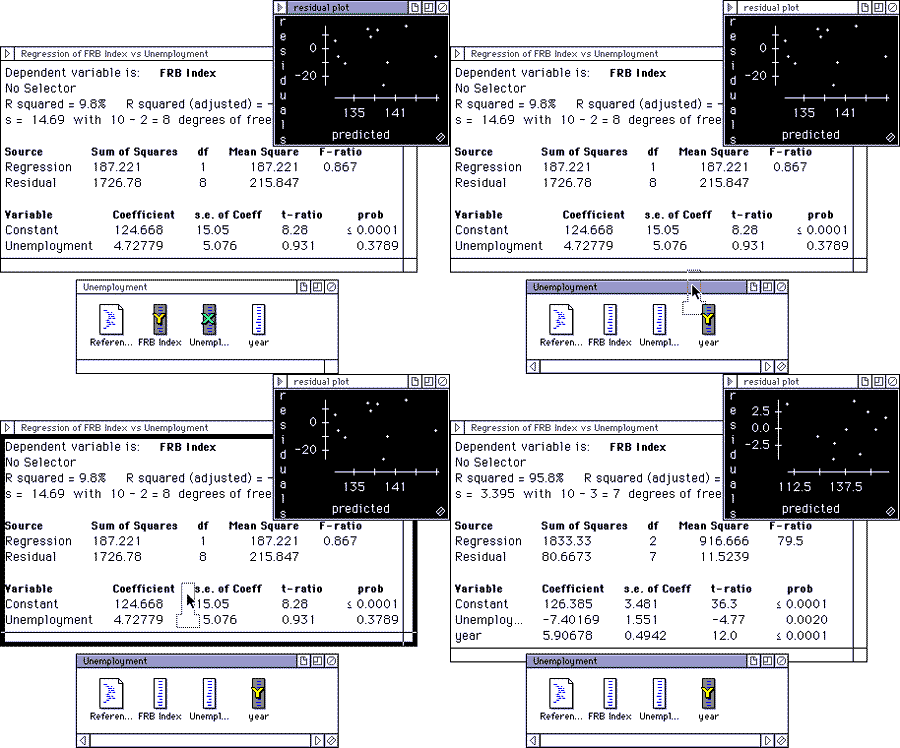
You can modify any Data Desk plot or table in place. Simply pick up a variable with your mouse, and drag it into the table. The table updates instantly. To change a variable in a plot, drag a new variable onto an axis.
The example above shows a regression and residual plot predicting the Federal Reserve Board Index of economic indicators from the Unemployment rate. To add the variable Year as a second predictor just drag "year" into the output table. The table and the plot update instantly so the effect of the new variable is easy to see.
|
| DataDeskのTopページに戻る |
|
|

