|
|
|
 |
|
|
データ可視化,データマイニングおよび統計のための高速な直感的ツール
DataDesk
|
|
直接操作が行えるインタフェース

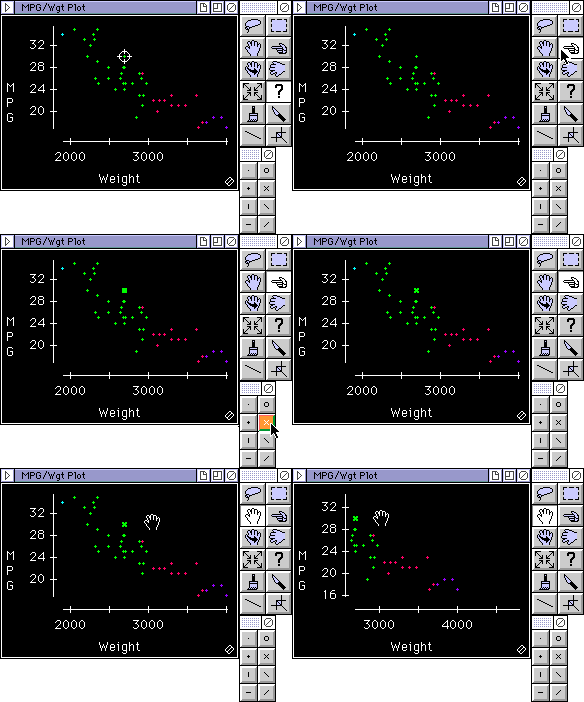
Data Desk's direct manipulation interface provides "first person" interaction with your data rather than the "third person" interaction found in most programs. Instead of giving the computer a command (by typing it or filling in a dialog screen), you just pick up the appropriate tool or icon and do the job directly. So, if you want to reposition the points in a plot, don't tell Data Desk where to plot them verbally, pick them up with the hand tool and move them. If you want to identify a point, click on it. If you want to change the color or symbol of a point select it and click on the desired color or symbol in the palettes. If you want to rotate points in a rotating plot, push them. If you want a new variable on the x-axis of a plot, pick up its icon and place it on the axis. This direct interface lets you act more naturally, which simplifies and speeds analyses.
The example above shows the Query identifying a point, the Pointer tool selecting that point, a click in the symbols palette to change the display symbol, and the Hand tool repositioning the points to make it easier to see the point's y-axis value.
|
| DataDeskのTopページに戻る |
|
|

